Simplified ASP.NET MVC Charts
If you've built any kind of dashboard, you know that charting is absolutely necessary for your users (especially management). Today, we'll show you how to create a simple chart using Microsoft's charting library.

If you are looking for a way to create charts in ASP.NET Core, check out Charting in ASP.NET Core.
Over the past five years, I've worked for two companies that have asked me to either create a dashboard or maintain an existing one. They asked me if I knew how to create charts.
As I think back to those days, I remember that the majority of the charts were built with WebForms as opposed to ASP.NET MVC. Of course, there are a lot of charting packages out there, but for today, we'll focus on building our own instead of using a JS charting package. Besides, there's nothing like having pure source code for your efforts, right?
If you've already used charts in your MVC Views, you know that placing code in your views is not a good practice. Your Views should not have any code in it. Your Views are dumb and should not have any logic at all (IMO, looping is an exception to the rule).
Today, we'll go through how to incorporate charts into your ViewModel and provide a cleaner way to display them in your views.
Overview
The charting library we'll be using will be the Chart class (the Web Helper), NOT the Chart class (WebForms).
When using the charting library, there are two immediate approaches that you could take, but there are consequences regarding these steps.
| If you use a: | the result will be: |
|---|---|
| Child Action | Inefficient because you may need to create a child action for each chart depending on your code |
| View | Your view will mix with code and HTML. You View should just hold HTML and be as clean as possible. |
One approach we'll take in this post is to create the chart, pass it in through your ViewModel, and then just write out the Chart.
If you need a refresher on ViewModels, I will refer you to the following material:
- ASP.NET MVC Model: Make a BaseViewModel for your Layouts
- ASP.NET MVC ViewModel: Make your ViewModels More Functional
If you need a refresher on HtmlHelpers, I refer you to the following material:
Saving the Chart In The ViewModel
First problem we need to overcome is passing the chart to the view, which is simple with our ViewModel.
ViewModel\ChartViewModel.cs
using System.Web.Helpers;
namespace WebGridExample.ViewModel
{
    public class ChartViewModel
    {
        public Chart Chart { get; set; }
    }
}
For our controller, I created a ChartController just to make this example a little easier to digest, but in essence, you would call your repository to build up your chart somewhere else using the data series.
Controllers\ChartController.cs
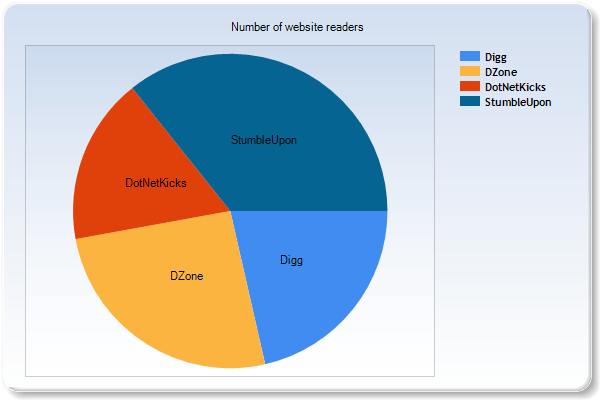
using System.Web.Helpers;
using System.Web.Mvc;
using WebGridExample.ViewModel;
namespace WebGridExample.Controllers
{
    public class ChartController : Controller
    {
        // GET: User
        public ActionResult Index(int? page)
        {
            var model = new ChartViewModel
            {
                Chart = GetChart()
            };
            return View(model);
        }
        private Chart GetChart()
        {
            return new Chart(600, 400, ChartTheme.Blue)
                .AddTitle("Number of website readers")
                .AddLegend()
                .AddSeries(
                    name: "WebSite",
                    chartType: "Pie",
                    xValue: new[] { "Digg", "DZone", "DotNetKicks", "StumbleUpon" },
                    yValues: new[] { "150000", "180000", "120000", "250000" });
        }
    }
}
Personally, I like my charting to be created on the server as opposed to writing it in the View with a @{ }. Now, I can have a data-driven charting model.
Finally, we have our Chart\Index.cshtml View, which is quite simply a write statement.
Views\Chart\Index.cshtml
@model WebGridExample.ViewModel.ChartViewModel
@{
    Layout = null;
}

<!DOCTYPE html>

<html>
<head>
    <meta name="viewport" content="width=device-width" />
    <title>Index</title>
</head>
<body>
<h2>Our Awesome Chart!</h2>

@Model.Chart.Write(format: "png")
</body>
</html>
The above produces the following chart.
Custom Styling
Now, I know what you're thinking..."Blue is not my color. How can I create my own chart styles?"
Glad you asked!
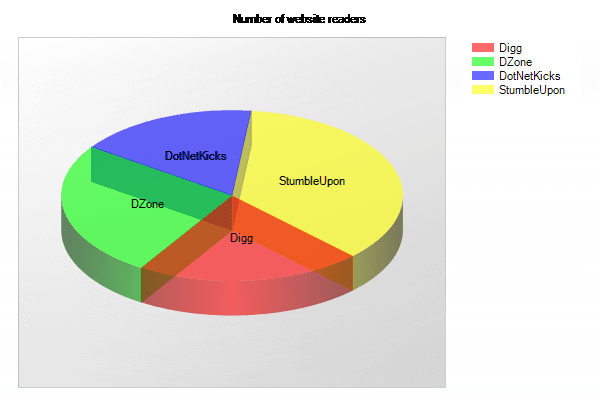
The ChartTheme class is strictly a collection of static string methods returning the classic WebForm Charting syntax. So if you wanted to make your own snazzy 3D theme for a Pie Chart, you could write:
        private string GetMyCustomTheme()
  {
      return @"
<Chart BackColor=""#555"" BackGradientStyle=""TopBottom"" BorderColor=""181, 64, 1""
   BorderWidth=""2"" BorderlineDashStyle=""Solid"" Palette=""SemiTransparent""
   AntiAliasing=""All"">

   <ChartAreas>
      <ChartArea Name=""Default"" _Template_=""All"" BackGradientStyle=""DiagonalLeft""
         BackColor=""Transparent"" BackSecondaryColor=""LightGray""
         BorderColor=""64, 64, 64, 64"" BorderDashStyle=""Solid""
         ShadowColor=""Transparent"">

         <Area3DStyle Enable3D=""True"" Inclination=""60"" Rotation=""45""/>
      </ChartArea>
   </ChartAreas>
</Chart>";
  }
Your GetChart method would pass in the GetMyCustomTheme() for your theme (changes in bold)
private Chart GetChart()
{
    return new Chart(600, 400, GetMyCustomTheme())
        .AddTitle("Number of website readers")
        .AddLegend()
        .AddSeries(
            name: "WebSite",
            chartType: "Pie",
            xValue: new[] { "Digg", "DZone", "DotNetKicks", "StumbleUpon" },
            yValues: new[] { "150000", "180000", "120000", "250000" });
}
The above code produces the following chart:
Conclusion
Today, I showed you the simplest way to create charts through ASP.NET MVC and provided a starting point for you to create your own stylish charts using Microsoft's charting library.
Also, we have only scratched the surface of the charting types available. There are a ton of charts you can use with Microsoft's Charting library. I didn't realize there were so many available. To reference them, check the MSDN site for the Chart Types.
If the executives at your company are looking for more charts, more interactive capabilities, and more ways to drilldown into data than what Microsoft has provided in their charting library, then I would recommend HighCharts. It's a JavaScript library and works with a number of browsers automatically.
I've also used it numerous times in the past and it's a tremendous charting package.
Trying to figure out how to change the colors of your series on your ASP.NET MVC charts? Please read Quick Tip: How to Change Colors in ASP.NET MVC Charts.
Besides Microsoft, what other charting libraries would you recommend to developers if they needed a charting library? Post your comments below.